DesignCap Review: Legit Infographic Creator Or Overhyped?
DesignCap says that time is the new money & it is that humans have less and less attention span. This deficit makes visual content even more essential to generate interest in our audience. Therefore, infographics are a simple and enlightening way to capture the reader’s attention and provide information in a fresh and easy-to-digest way.

All good marketers and bloggers know that infographics are essential for producing great content or getting your message across as clearly as possible. They are easy to understand, and they are instantly visible. With the right tools, you can essentially cram the topic of an entire article into one image, and your target audience will digest it in seconds. Let’s get in more detail in this DesignCap review.
What is an infographic
An infographic is, essentially, a visual representation of data or content, presented in a much more attractive and suggestive format than the normal written text. It is true that an infographic may not achieve an exhaustive depth of information as a text would. Still, it is undoubtedly much more attractive while recounting and transmitting the same content.
Its aesthetic and didactic qualities make this tool a must in our marketing strategy. In fact, more and more companies are improving and promoting their websites through marketing campaigns. Therefore, it is vital to offer differentiating content to face the competition. Infographics offer the opportunity to present our content in a dynamic way so that it can stand out from its competitors.
In short, these graphics are used to represent a large amount of information in a single image. It’s a quick way to get your point across quickly, as modern readers tend to seek out accessible and brief information instantly.
Also, sometimes graphics make more sense than long text paragraphs, and it’s a faster and easier way to get your point across.
It’s like the infographic is a gift from the sky. However, it could also be a curse. In a world where infographics are becoming a standard in blogging and marketing, you must be careful and present it in an engaging and accurate way. Fortunately, the Internet has all the tools you need. In this article, I’ll talk about the one I use often. It’s DesignCap Infographic Maker.
Detailed Review: What is DesignCap?
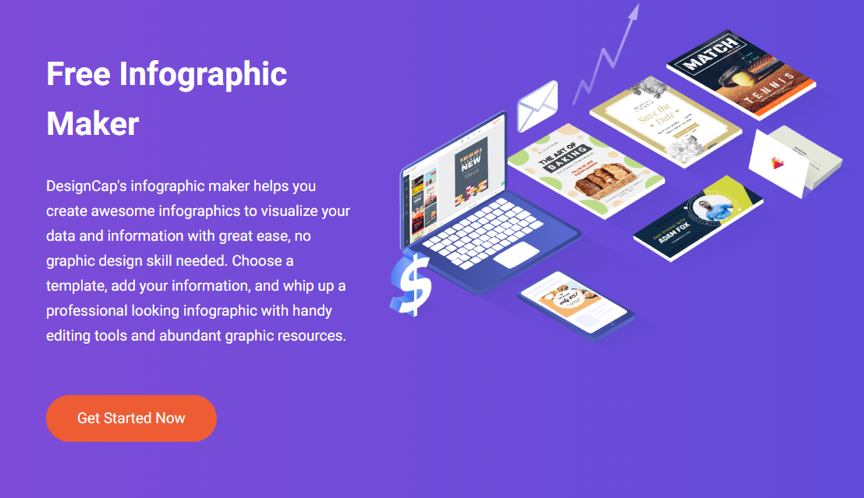
DesignCap’s powerful infographic maker helps you visualize your data and information in minutes. Even if you are not a designer, you can create an infographic in 3 steps easily.
This simple, intuitive, and comprehensive service can help you create many other quality designs quickly. Don’t think that it will turn you into a graphic designer overnight, but it will put at your fingertips a series of tools that will guide you through the creative process. Besides being free, it can be used by any browser from any device.
Whether for the creation of an infographic, a pdf catalog, a presentation, a business card, a chart, or visuals adapted to different social networks: Facebook, Pinterest, Instagram, Twitter, DesignCap is a good choice. This tool would be one of the most straightforward and most efficient applications of the moment.
How to create an infographic?
In fact, this tool is used frequently by people who are not professionals, but this new system can give you surprising results—nothing to envy a professional. Below, we put together a step by step to make a perfect infographic using this online software.
Choose an infographic template
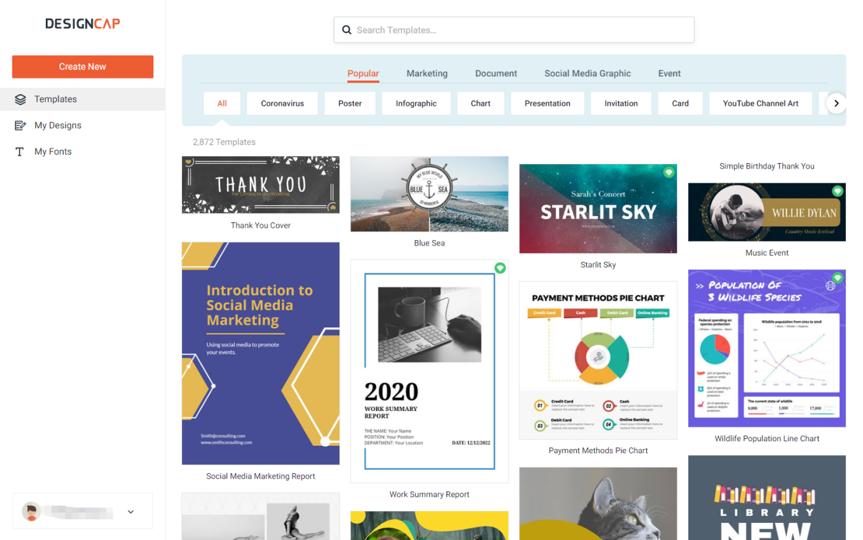
First of all, review & pick an appropriate infographic template on DesignCap to represent your data. There are many infographic templates in the portal. I’ll list the six most used here:
- Comparison infographic: This type of infographic will help you prove the advantage of one concept over another or explain the differences between two objects.
- The process infographic: Usually we use as how-to infographic, this infographic will present the steps to reach an endpoint.
- Geographic infographic: This infographic would gather image data related to geographic locations, demographics, or large amounts of data.
- The timeline infographic: As the name suggests, this design aims to tell a story over time, whether it’s the creation of a concept, the biography of a celebrity.
- Hierarchical infographic: Often represented in the form of a multi-level graph, it is ideal for presenting a new workflow for an organization or a food chain, for example.
- The statistics infographic: These infographics are ideal for imaging survey results, presenting data from multiple sources, or illustrating a topic using related data. It will focus on your data with a specific layout and visuals to illustrate the information.
You will understand that an infographic is mostly in portrait format, and for the simple reason, this way, you can divide it into several small parts. And there are many other types of infographics provided by DesignCap, such as informative infographics, CV infographics, photo-text infographics, flowchart, etc. Choose one that meets your needs.
Customize The infographic
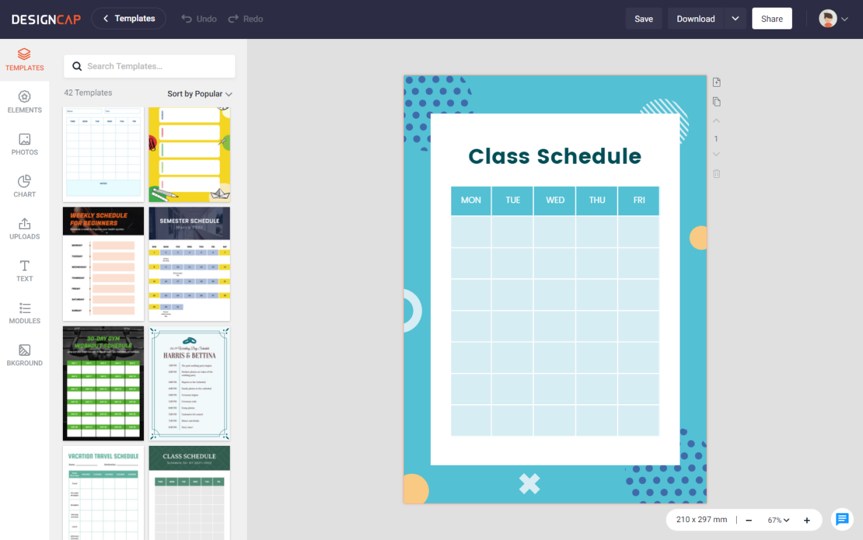
Now it’s time to customize the infographic according to your audience, subject, content, and format you like.
Add Text
The most crucial step in making an infographic is adding text. Text is to use semantics that fits your niche and catches its interest. Keep in mind that your headlines and captions should be relevant, interesting, and unique. You can take inspiration from the titles of your own blog posts or that of your competitors. Please do not overdo it. Otherwise, you risk losing readability. Changing the font for your infographic can have a huge impact on its effectiveness. Once you add your text in the design, you can edit its color, font, alignment, and more. DesignCap allows you to upload your font from your computer as well.
Edit the photos and graphics
You chose to make your computer graphics yourself, but you are not a graphic designer or illustrator? Don’t worry. DesignCap offers various handy photo editing tools that allow you to apply photo effects and adjust its contrast, exposure, saturation, etc. You can add photos, shapes, icons, and other elements to your infographic. DesignCap provides millions of free stock images and millions of icons in its database. If you don’t want to use those preset, you are able to upload your own too.
Add charts to show data clearly
DesginCap allows you to let your creativity run wild with chart options. These charts have the ability to immediately grab the reader’s attention just because they quickly emphasize the data. You can choose to add a table, column, pie, and other charts to display your data. With DesignCap, you have the option to upload your data directly from files of CVS, XLSX, or XLS. It is brilliant and convenient if you have a large number of data to display. What’s more, you can search for a location with its name and add the dynamic maps of this location into your infographic. Then you can fine-tune the color, value, style, etc.
Other settings
With DesignCap, you have more options to customize the background or get an agile organization to the images and text with the preset modules. All can be easily accessed with a few mouse clicks. You can do it according to your needs.
Easy sharing
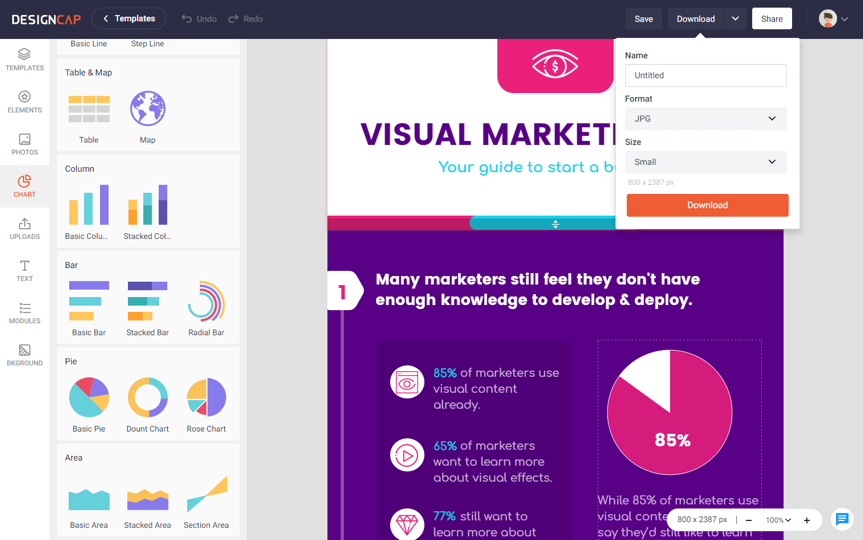
The last thing left for you is to publish and promote your infographic anywhere you want. You can download the infographic as JPG, PNG as well as PDF in DesginCap. You can also share it with social media or any other where online with a URL produced by the app. It’s up to you. To be more flexible, DesignCap will automatically save your project into your account online & you can review it anytime if you want to make some changes later.
Pros of DesignCap
- It’s simple, online, and free. With the free version, you can finish almost all of your daily designs that meet your needs.
- Designcap offers thousands of beautiful ready-made templates for different topics and different platforms, such as infographics, YouTube banners, reports, presentations, schedules, Facebook covers, YouTube thumbnails, etc. review & apply it as per requirement.
- It has a library with more than a million stock images and icons. All of the images stocked in this app are free of charge.
- Those who are not satisfied with the extensive image gallery can upload their own ones.
- It’s very flexible to import data from the spreadsheet and change the design color, size, style, change text fonts, editing photos, etc.
- Everything can be down online without downloading and installing any software on your computer. It will auto-save your design to the cloud in case you want to make some changes next time.
- DesignCap gives users several exporting options to download as JPG, PNG, PDF, or PPTX for presentation.
Cons
No mobile version now.
Pricing Of DesginCap
The free plan of DesignCap is quite extensive. The only restrictions are the use of premium resources, which can be purchased through the DesignCap premium plans. DesignCap offers two paid plans: Basic&Plus.
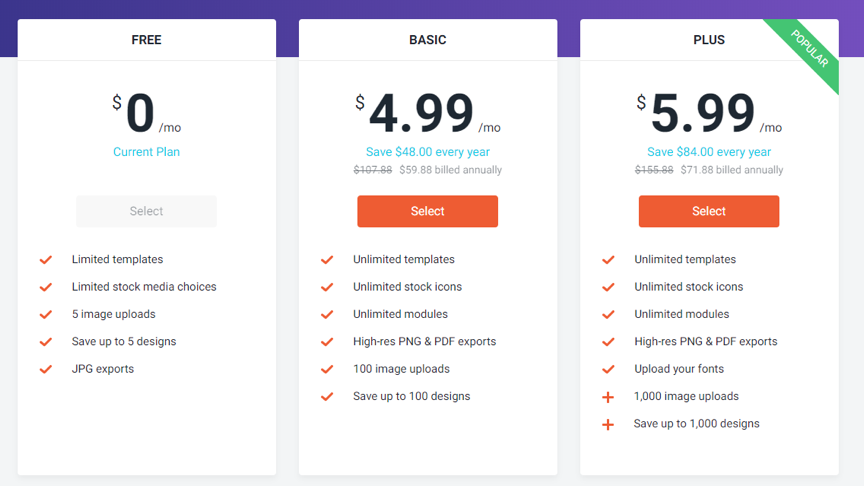
For the Basic plan, you can enjoy the following features:
- Unlimited templates
- Unlimited stock icons
- Unlimited modules
- High-res PNG & PDF exports
- 100 image uploads
- Save up to 100 designs
For its Plus plan, you can enjoy more:
- Unlimited templates
- Unlimited stock icons
- Unlimited modules
- High-res PNG & PDF exports
- Upload your fonts
- 1,000 image uploads
- Save up to 1,000 designs
Both of the two plans can be available monthly or annually. The basic plan will cost you $4.99/month if you bill it annually, while it will cost $8.99 if you billed monthly. For the plus plan, you need to pay $5.99/month if you bill it annually while you need to pay $12.99 if you billed monthly.
We suggest you review every feature as per requirement on DesignCap pricing plan & purchase according to that.
Who is DesignCap For?
If you are new to design, it will surely be very useful because the tool has a free version that allows you to use images, templates, and different fonts.
Although if your designs require more potential, you can grab the plus version, which allows you to many more art resources and features.
DesignCap can be as versatile as you want. However, it maintains its limitations between the free and pro version. Its most justifiable use is that it is not a tool for professional designers or to obtain that result.
In short, it all depends on what you need it for and the immediacy that it guarantees. Before using the DesignCap tool, analyze & review well when it can be useful and get you out of trouble.
About its Company
DesignCap is developed by PearlMountain, which is started up since 2006. And it has developed many graphic design apps on Mac and windows before such as Picture Collage Maker, CollageIt, Publisher Plus, FotoJet, DesignEvo, FlexClip, Greeting Box, etc. With more than ten years of experience in the design world, they want to help more and more non-designers create graphic designs like a pro. Thus, DesignCap came out.
Gathering the experience and knowledge of the professional design team of PearlMountain, DesignCap takes its shape. It presents access to a vast built-in database, offering thousands of high-quality templates and a vast collection of illustrations, shapes, stylish fonts for selection. Even if you are a design novice, you can create professional designs without difficulty.
Conclusion Of DesignCap
One way to communicate a large amount of information is to create an infographic, which is basically a visual representation of a group of data. Because they are made up of images, it is easier to see all the information at first glance. In business, they are commonly used to share information gathered from study or research, although they actually have many other applications.
You can use an infographic to compare products, diagram sales, or simply entertain your customers. It could also be used to show your workflow, financial data, or even explain programs to your employees. The limit is your imagination.
But if you don’t have graphic skills, don’t worry, generating one of these doesn’t involve a lot of work and you don’t have to pay a lot of money either. Use DesignCap Infographic Maker, the easy design service that can be accessed from a web browser.
It offers robust graphic design tools, as well as design templates for infographics, charts, reports, business cards, Twitter headers, etc. Free users can access most of the tools and features on the site. Hope you like this DesignCap review & don’t forget to share it, if you have queries then comment below