5+ Best TradingView Alternatives For Better Trading
Looking for the best TradingView alternatives that match your trading needs? 🤔📊
TradingView is widely used, but it may not suit every trader’s strategy, budget, or analysis style.
💥 TrendSpider Coupon Code – Get 66% Off Advanced Plan!
Unlock the power of advanced technical analysis with TrendSpider. Use this exclusive coupon code to save 66% on the Advanced Plan and elevate your trading game—don’t miss out on this limited-time deal!
Platforms like Koyfin, TrendSpider, Finviz, StockCharts, Trade Ideas, & TC2000 offer different strengths from advanced charting and automation to deep market data and powerful screening tools.
Whether you’re a beginner learning technical analysis or a professional trader managing complex strategies, the right platform can make a big difference.
In this article, we explore 5+ best TradingView alternatives, compare their key features, and help you decide which one fits your trading goals best 🚀📈
🏆 Koyfin Wins!
Best TradingView Alternative for Smart Traders
#1. Koyfin
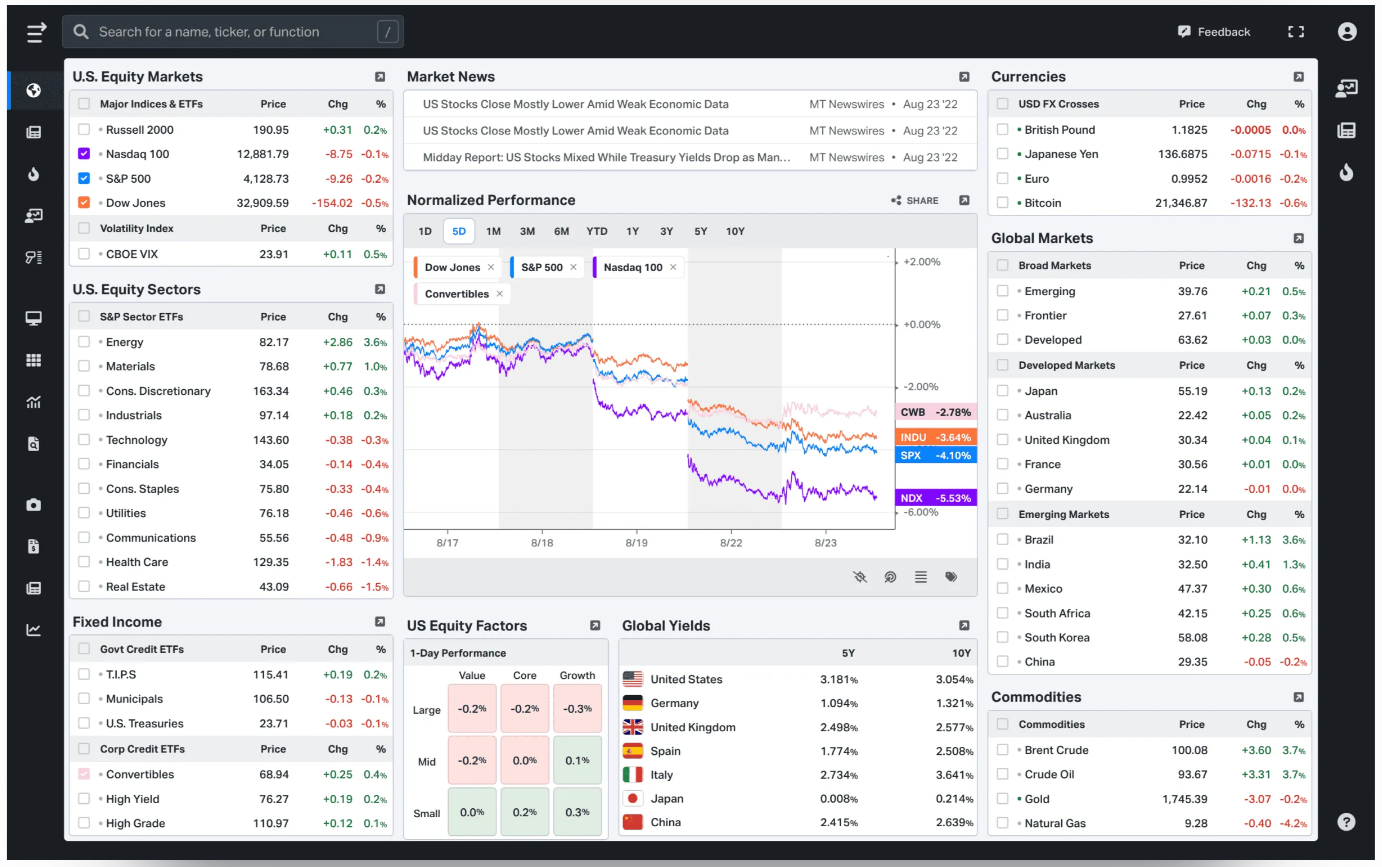
Koyfin is a powerful financial research and market analysis platform. It helps traders, investors, and analysts track markets, study data, and make better decisions.
The platform focuses on stocks, ETFs, economic data, and global markets. It brings charts, financial statements, and macro data into one clean dashboard.
Koyfin is known for its deep data access and professional-grade tools, yet it is still easy to use. You don’t need advanced technical skills to get started.
Key Features of Koyfin 🚀
1. Advanced Market Data
Koyfin provides access to a wide range of market data, including stocks, ETFs, indexes, commodities, and currencies. You can view both real-time and historical data, which helps you track price movements and market trends over time. This makes it useful for daily monitoring as well as long-term analysis.
2. Powerful Financial Charts
The platform offers clean and flexible charts that allow you to analyze price trends easily. You can add indicators, compare multiple assets on one chart, and switch between timeframes. These tools help traders and investors understand market behavior more clearly.
3. In-Depth Company Financials
Koyfin displays detailed company financial information such as revenue, earnings, balance sheets, and cash flow. The data is presented in a clear format, making it easier to evaluate a company’s performance and financial health without confusion.

4. Economic & Macro Data
You can track important economic indicators like inflation rates, interest rates, employment data, and GDP. This feature is helpful for understanding the bigger picture and how global events impact financial markets.
5. Custom Dashboards & Watchlists
Koyfin lets you create personalized dashboards and watchlists. You can follow specific stocks, markets, or economic indicators in one place. This saves time and helps you focus only on the data that matters to your trading or investing strategy.
Pricing Plans of Koyfin 💰
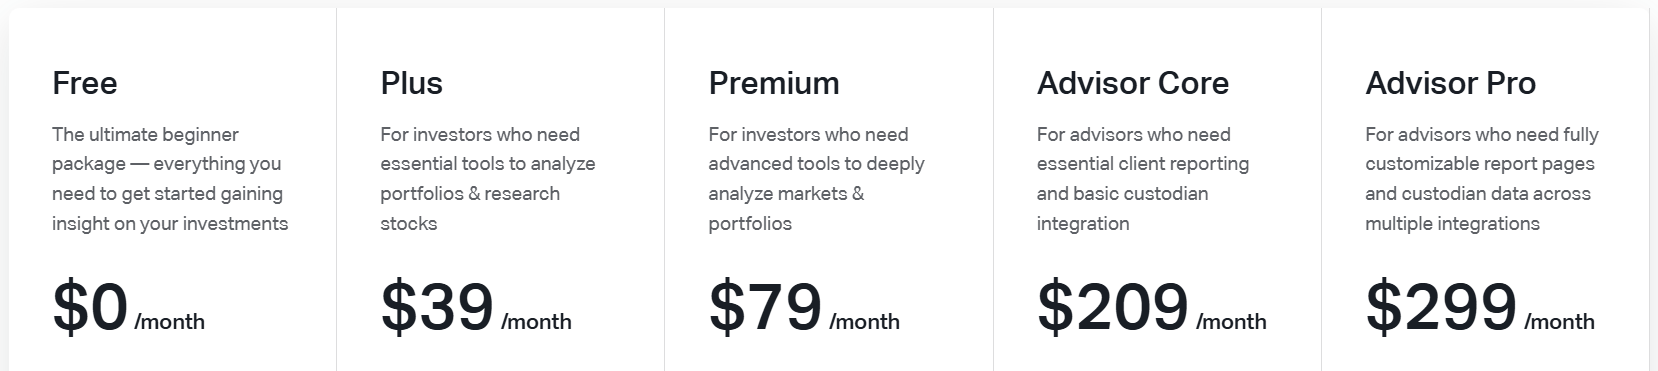
- Free Plan – $0/month
Perfect for beginners who want basic market insights, charts, and portfolio tracking. Includes limited financials, watchlists, dashboards, and macro data. - Plus Plan – $39/month
Best for active investors who need deeper stock and ETF research tools. Offers long-term financial data, screeners, unlimited dashboards, and premium news. - Premium Plan – $79/month
Designed for advanced investors who want detailed market and portfolio analysis. Includes custom formulas, advanced analytics, and powerful valuation tools. - Advisor Core – $209/month
Built for financial advisors managing client portfolios and reports. Provides client proposals, model portfolios, and custodian integration. - Advisor Pro – $299/month
Ideal for professional advisors who need full customization and automation. Includes advanced reporting, multiple integrations, and priority support.
Pros & Cons of Koyfin ✅
| Pros 👍 | Cons 👎 |
|---|---|
| Access to deep global market and financial data | No built-in trading or order execution |
| Advanced charting with multiple asset comparisons | Limited real-time data on free plan |
| Strong focus on fundamentals and macro analysis | Higher pricing for premium and advisor plans |
| Highly customizable dashboards and watchlists | Can feel overwhelming for complete beginners |
| Professional-grade tools at a lower cost than Bloomberg | |
| Works fully in the browser with no installation needed |
#2. TrendSpider
TrendSpider is an advanced trading and analysis platform designed for both beginner and professional traders.
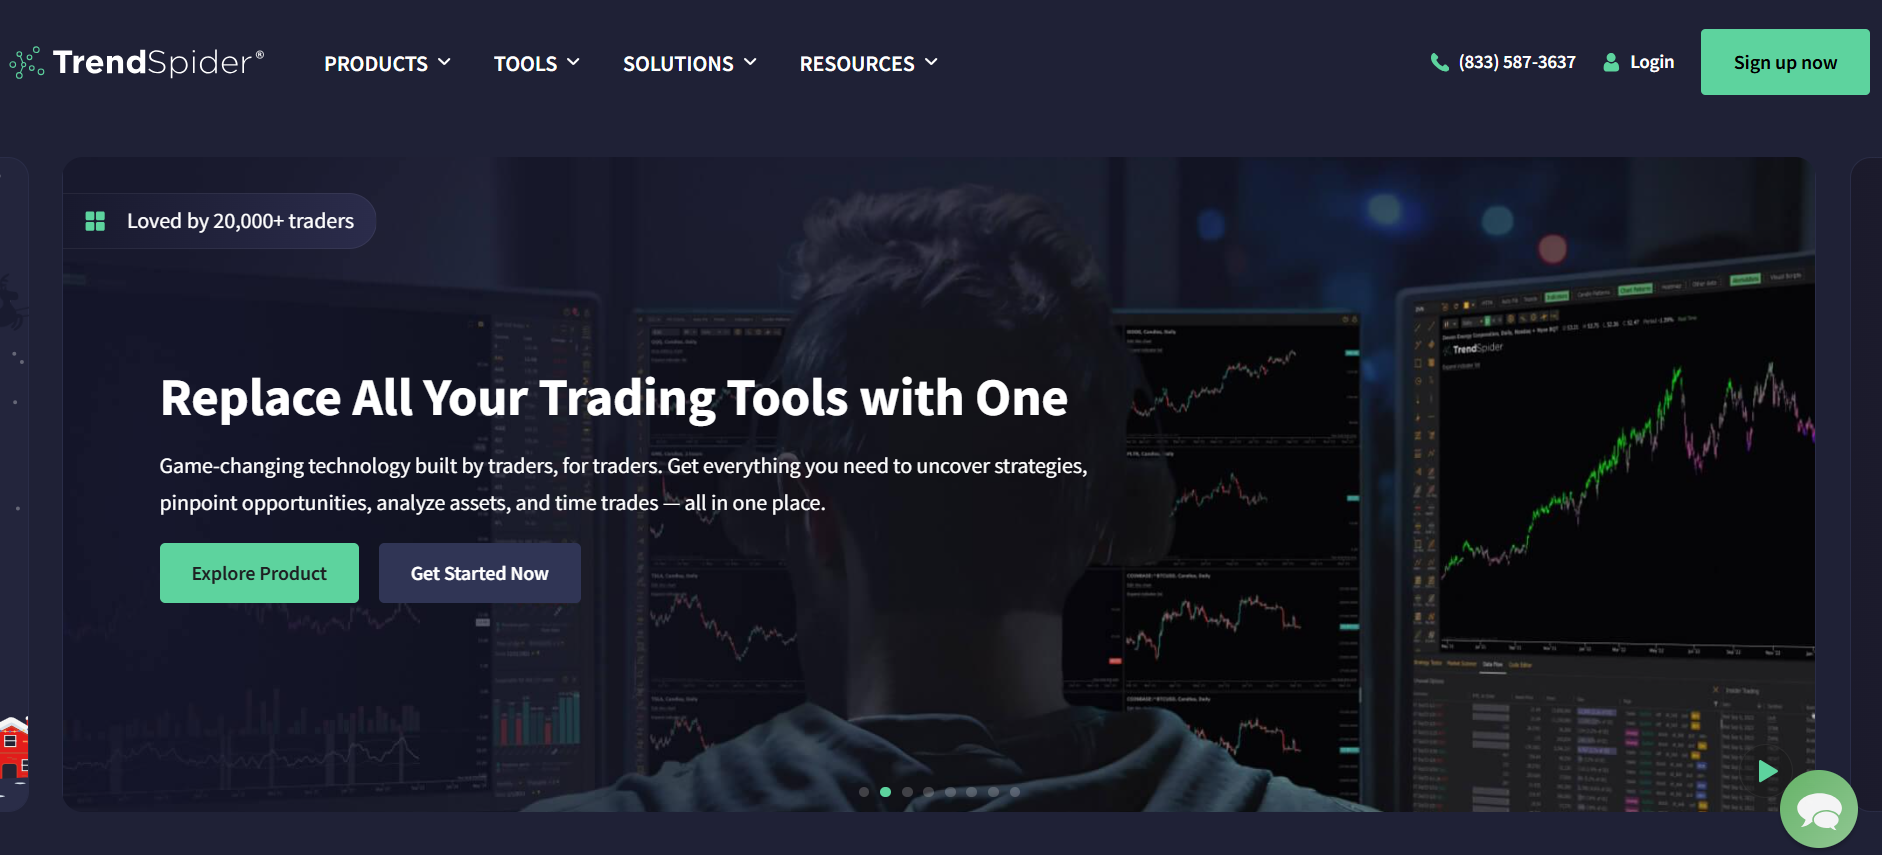
It combines technical analysis, charting, market scanning, and AI-driven tools all in one place, helping traders make smarter, faster, and more strategic decisions.
Key Features of TrendSpider 🌟
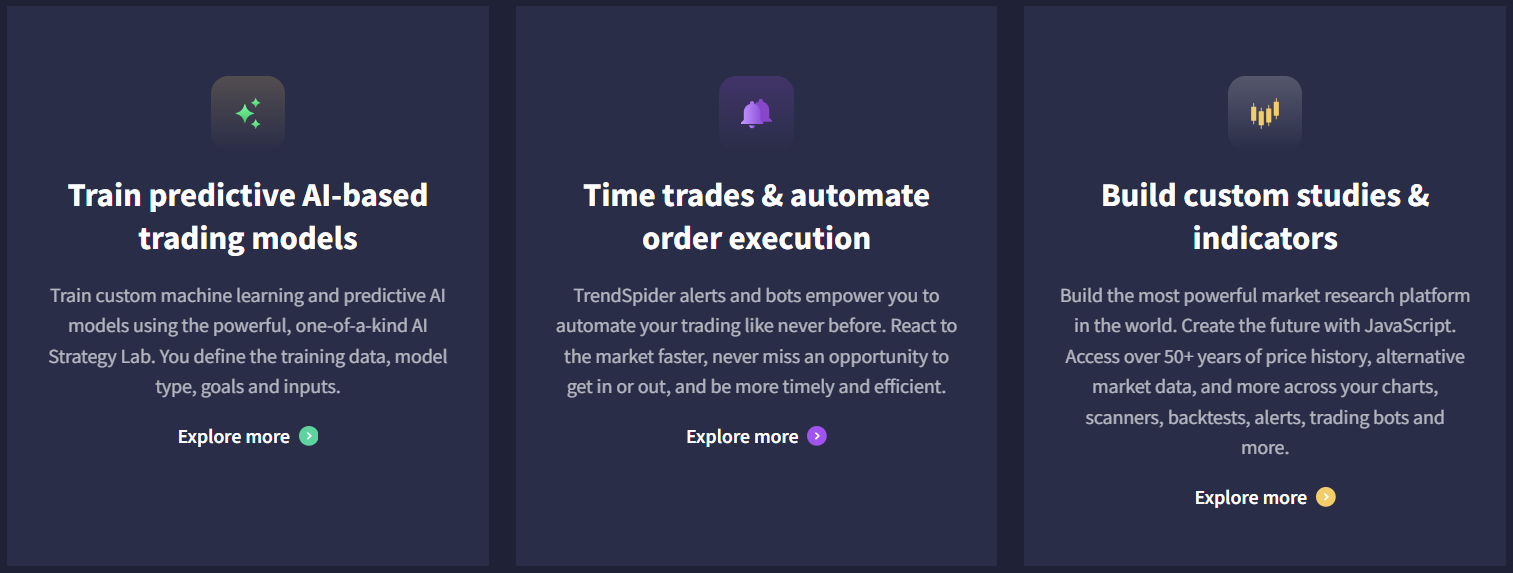
1. AI-Powered Trading Assistant (Sidekick) 🤖
TrendSpider’s Sidekick AI acts as your personal trading analyst. It can review charts, compare fundamentals, analyze SEC filings, and provide real-time insights. This saves you hours of manual research and helps you spot opportunities faster.
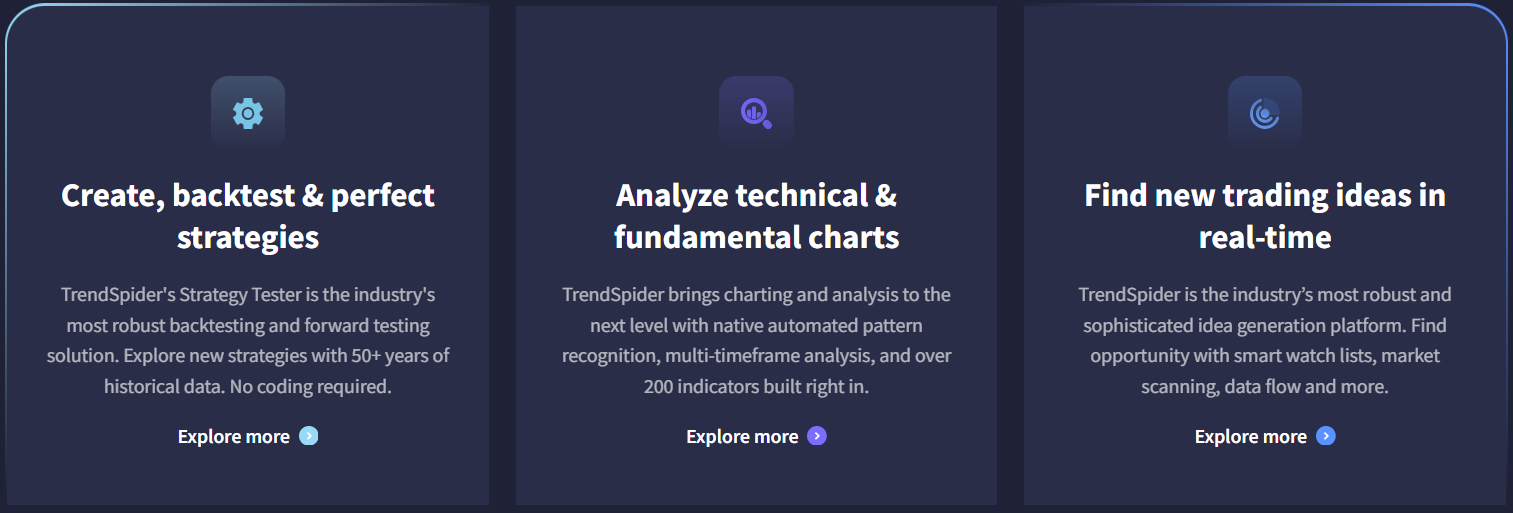
2. Automated Technical Analysis & Pattern Recognition 📊
The platform automatically identifies chart patterns, support/resistance levels, and trendlines across multiple timeframes. This streamlines technical analysis and ensures you don’t miss key trading signals.
3. Custom Indicators & Trading Bots 🛠️
Users can build custom studies, indicators, and AI-driven trading bots without coding knowledge. These tools integrate with charts, scanners, and alerts, enabling fully personalized trading strategies.
4. Real-Time Market Scanning & Idea Generation 🔍
TrendSpider provides advanced scanners to track multiple market conditions, stock behaviors, and price movements in real-time. This allows traders to discover opportunities that match their unique trading style.
5. Strategy Backtesting & Trade Automation 🚀
You can create, backtest, and optimize trading strategies using 50+ years of historical data. Combined with automated order execution, TrendSpider helps you implement and test strategies efficiently while reducing errors.
Pricing Plans of TrendSpider 💸
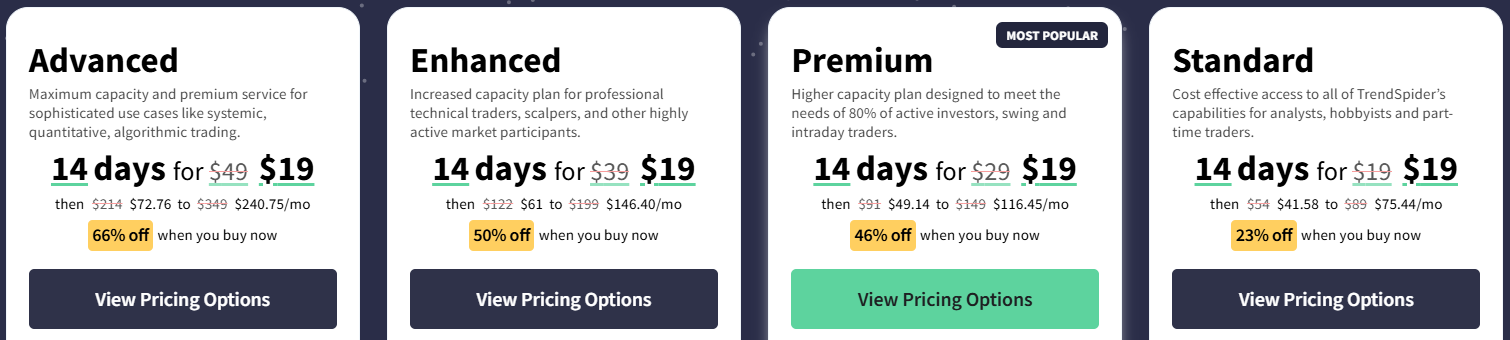
- Standard Plan – $19 For 14 Days
Affordable access to all TrendSpider features for hobbyists and part-time traders. Includes 5 workspaces, 5 trading bots, 10 alerts, and 1 training session per year. - Premium Plan – $19 For 14 Days
Designed for active investors and swing traders with more capacity for bots and alerts. Offers 10 workspaces, 10 trading bots, 50 alerts, and 2 training sessions per year. - Enhanced Plan – $19 For 14 Days
For professional technical traders needing higher usage limits and faster scanning/backtesting. Includes 15 workspaces, 50 trading bots, 100 alerts, and 3 training sessions per year. - Advanced Plan – $19 For 14 Days
Maximum capacity plan for algorithmic, quantitative, and highly systematic trading. Provides 20 workspaces, 100 trading bots, 400 alerts, and up to 52 training sessions per year.
Pros & Cons of TrendSpider ✅
| Pros 👍 | Cons 👎 |
|---|---|
| Automated technical analysis and trendline detection | Higher pricing tiers can be expensive for casual traders |
| AI-powered tools like Sidekick for strategy analysis | Some features like real-time futures data require extra fees |
| Multi-timeframe scanning and alerts | Limited number of free AI Sidekick messages per month |
| Customizable backtesting with slippage and cost adjustments | Steep learning curve for beginners due to advanced tools |
| Charting tools with over 300 indicators and Raindrop charts | |
| Supports multiple devices: desktop, browser, iOS, Android |
#3. StockCharts
StockCharts is an online financial charting and technical analysis platform designed to help traders and investors make smarter decisions in the markets.
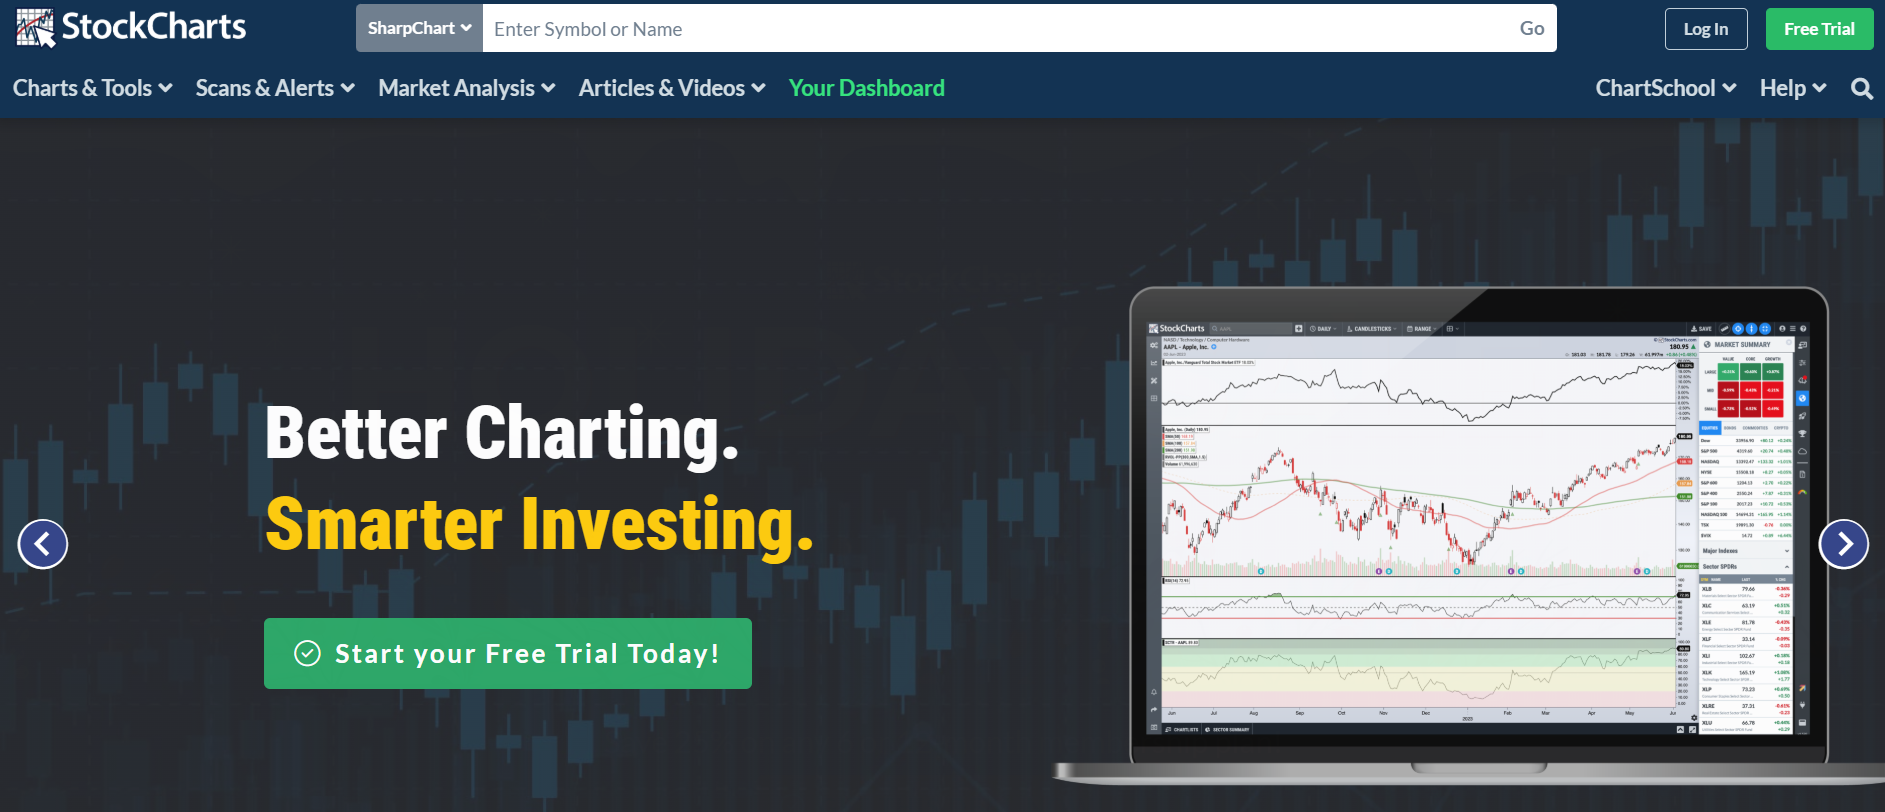
It provides advanced charting tools, market scanning, alerts, and portfolio management features. The platform is highly customizable and offers access to decades of historical data, multiple technical indicators, and overlays.
Key Features of StockCharts 🌟
1. Advanced Charting Tools
StockCharts offers interactive and highly customizable charts with multiple chart types, technical indicators, overlays, and multi-chart layouts. Users can analyze historical and real-time market data efficiently.
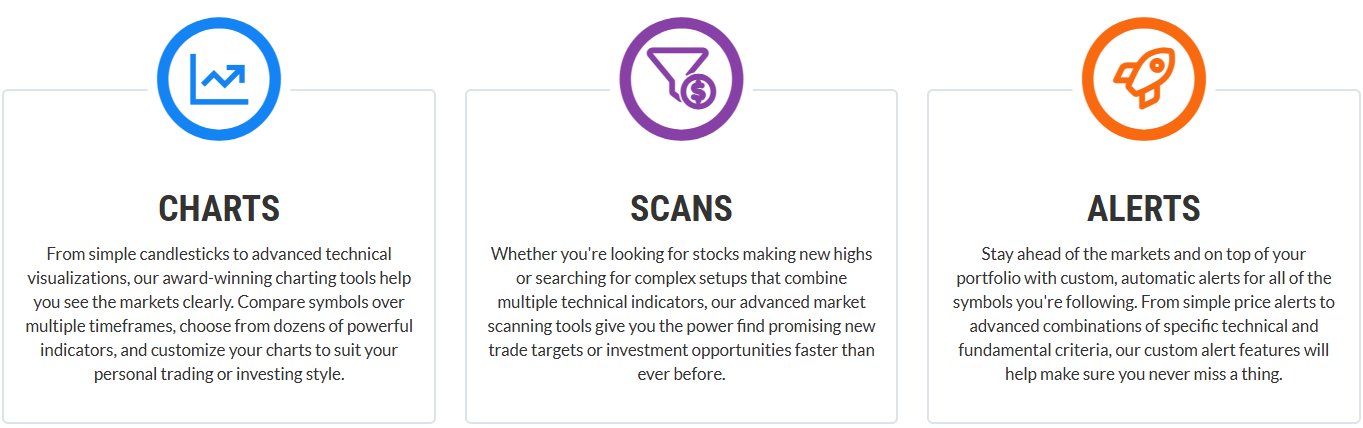
2. Market Scans & Alerts
The platform provides advanced scanning tools to identify stocks meeting specific technical or fundamental criteria. Users can set custom alerts, including price and technical combinations, to stay on top of market opportunities.
3. Portfolio & Trade Management
StockCharts allows users to organize and track their investments using ChartLists, save custom chart layouts, and manage multiple watchlists all in one platform.
4. OptionsPlay Integration
The OptionsPlay add-on ranks trade ideas based on optimal options strategies, providing actionable insights for traders looking to use options effectively.
5. Comprehensive Historical & Real-Time Data
The platform provides decades of historical data, real-time price updates, and multiple datasets per chart, enabling in-depth technical and long-term market analysis./ht
Pricing Plans of StockCharts 💰
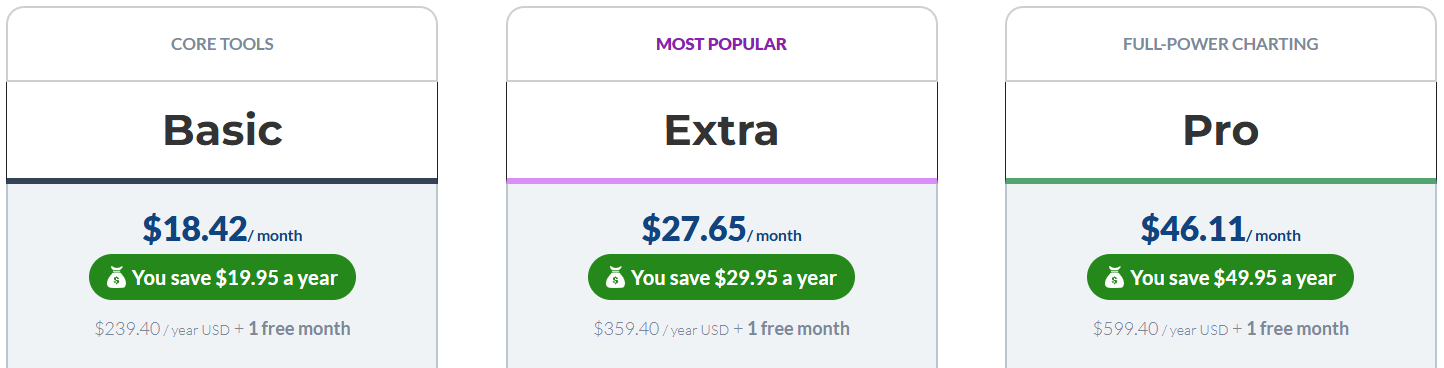
- Basic – $18.42/month ($239.40/year): Entry-level plan with access to essential charting tools, 25 indicators per chart, 1 saved multi-chart layout, and basic alerts. Ideal for casual traders or beginners looking to explore technical analysis.
- Extra – $27.65/month ($359.40/year): Expanded plan with 25 saved multi-chart layouts, access to ChartPacks, 200 custom scans, scheduled alerts, and enhanced portfolio management. Suited for active traders seeking more analysis and scanning capabilities.
- Pro – $46.11/month ($599.40/year): Full-featured plan offering 25 saved multi-chart layouts, up to 500 custom scans, 250 advanced alerts, and charting data back to 1900. Designed for professional traders needing maximum technical analysis power.
Pros & Cons of StockCharts ✅
| Pros 👍 | Cons 👎 |
|---|---|
| Advanced interactive charting with multiple indicators and overlays | Higher pricing compared to some other charting platforms |
| Customizable multi-chart layouts and ChartLists for portfolio management | Steeper learning curve for beginners |
| Access to long-term historical data (up to 50 years, Pro plan to 1900) | Some features like ChartPacks only available in higher-tier plans |
| Advanced scanning tools and scheduled alerts to track market opportunities | Limited direct broker integration for trading |
| Trade directly from charts and access members-only commentary | |
| Comprehensive platform for all trading styles with flexible pricing plans |
#4. Finviz
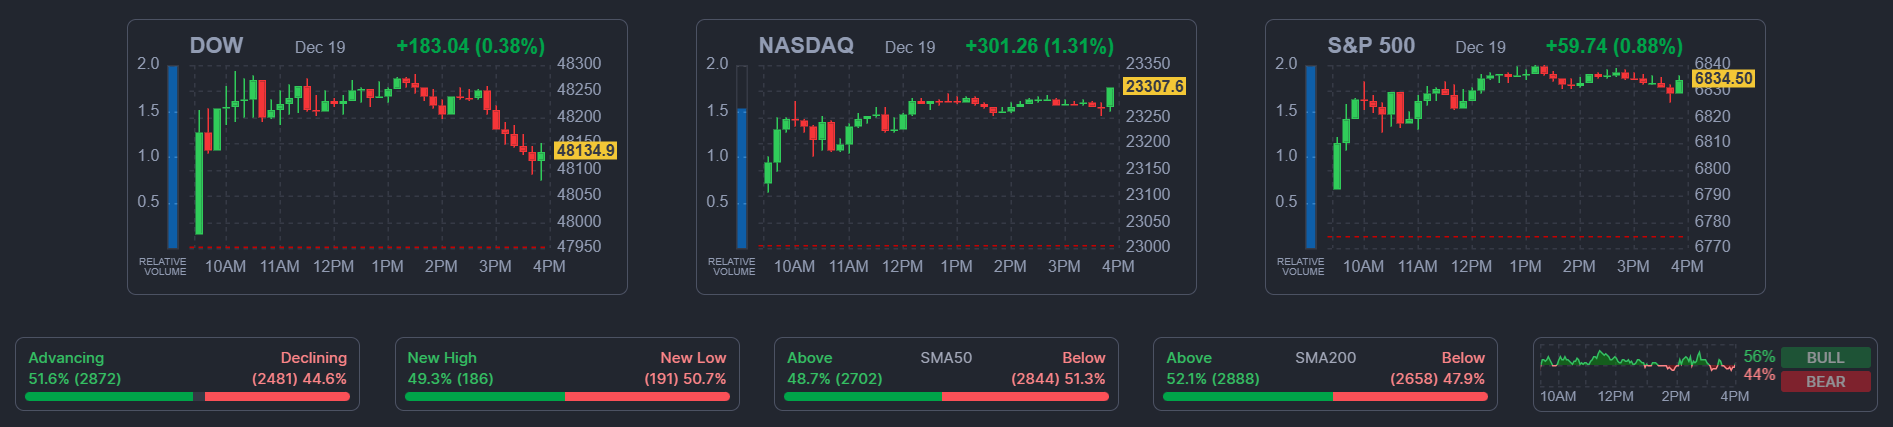
Finviz is a web-based financial platform that provides market data, stock screening, charts, and portfolio management tools.
It is widely used by traders and investors to analyze equities, ETFs, and other financial instruments with powerful filters, real-time data (Elite version), and visual insights.
Finviz Elite unlocks advanced features like interactive multi-layout charts, real-time alerts, and data export for professional trading and long-term investing strategies.
Key Features of Finviz ✨
- Interactive Multi-Layout Charts
Switch between chart layouts, draw patterns, and add technical indicators with automatic saving of studies for a deeper analysis of watchlisted tickers.
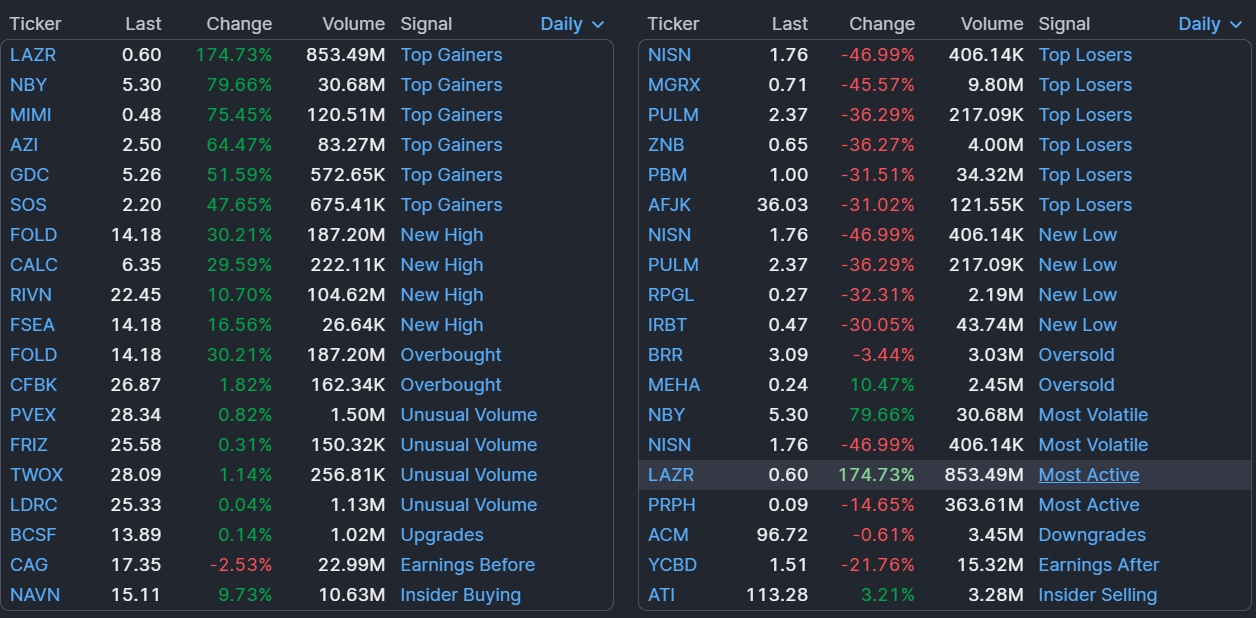
- Award-Winning Screener
Use 20+ advanced filters and personalized views to quickly identify trade opportunities and analyze technical and fundamental metrics. - Real-Time Data
Access premarket, after-hours, and intraday data in Finviz Elite to act quickly on market movements with an ad-free interface.
- Unlimited Alerts & Notifications
Receive timely notifications via email or push for price changes, news, ratings, insider trading, and SEC filings. - Export Data & APIs
Export screener results, portfolios, and news to Excel, and use APIs for automated analysis in Google Sheets, Python, or JavaScript.
Pricing Plans of Finviz 💰
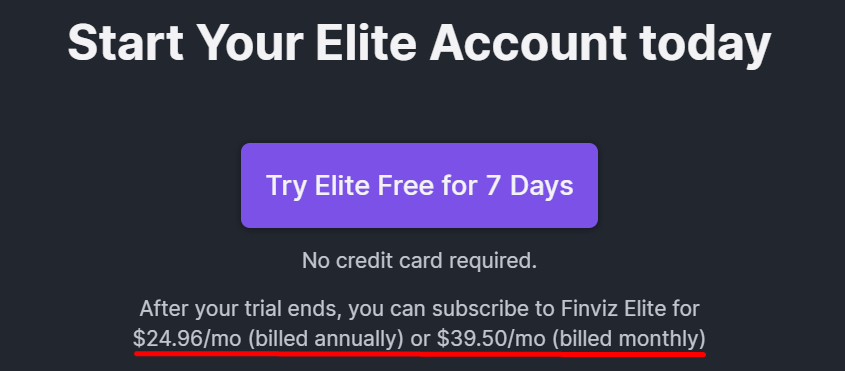
- Free Account
Access delayed quotes, charts, and screener data with basic portfolio tracking and limited alerts. Good for casual users exploring the markets. - Finviz Elite ($24.96/mo billed annually or $39.50/mo monthly)
Unlock real-time data, interactive charts, unlimited alerts, full ETF breakdowns, and API access. Ideal for active traders and investors seeking professional tools.
Pros & Cons of Finviz ✅
| Pros 👍 | Cons 👎 |
|---|---|
| Interactive charts with multiple layouts and technical studies | Free plan only offers delayed data |
| Powerful stock screener with advanced filters and presets | Limited historical data compared to professional platforms |
| Real-time quotes, premarket and after-hours data (Elite) | No broker integration for direct trading |
| Unlimited email and push alerts for price, news, and insider activity | Higher monthly cost for Elite users |
| Export data and use APIs for automated analysis | |
| Comprehensive ETF insights including holdings and performance metrics |
#5. Trade Ideas
Trade Ideas is an AI-driven trading platform that helps traders identify high-probability stock opportunities in real-time.
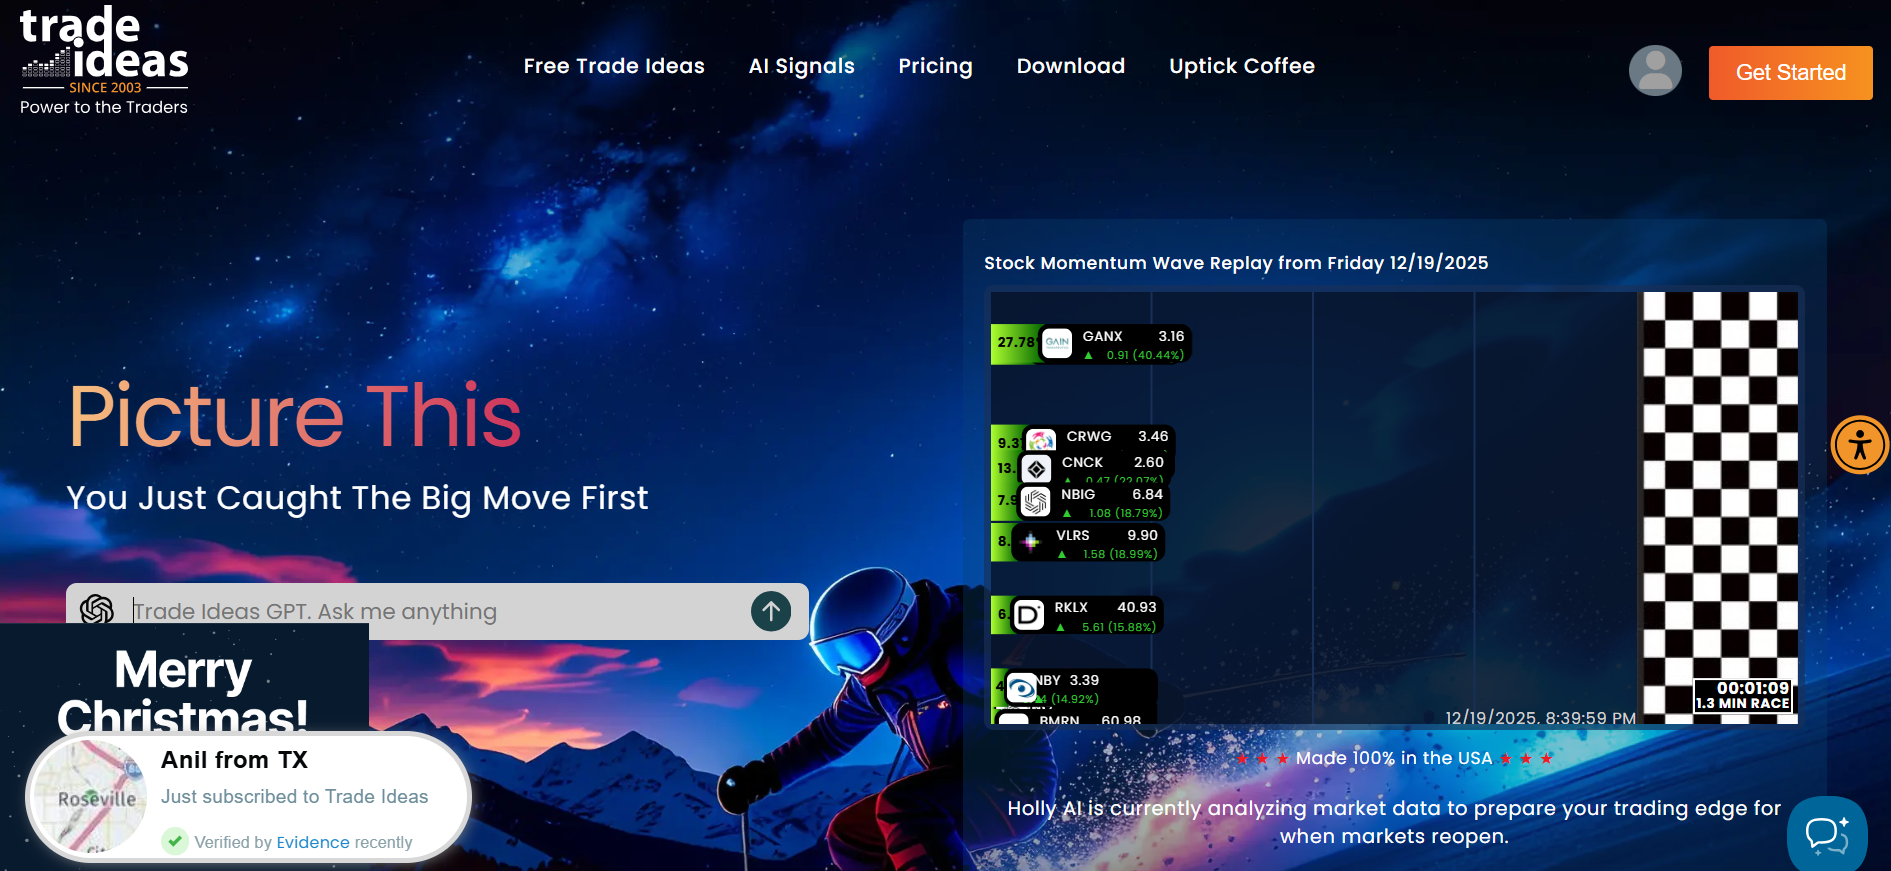
Using proprietary AI tools like TradeWave and the Money Machine, it provides actionable buy and sell signals, backtesting, automated trading, and portfolio monitoring.
It’s widely used by active traders, professional investors, and brokers seeking advanced technical analysis and momentum detection.
Key Features of Trade Ideas 🌟
- TradeWave Signals
Provides clear visual buy and sell signals with precise entry and exit points, using real-time AI analysis of market momentum.
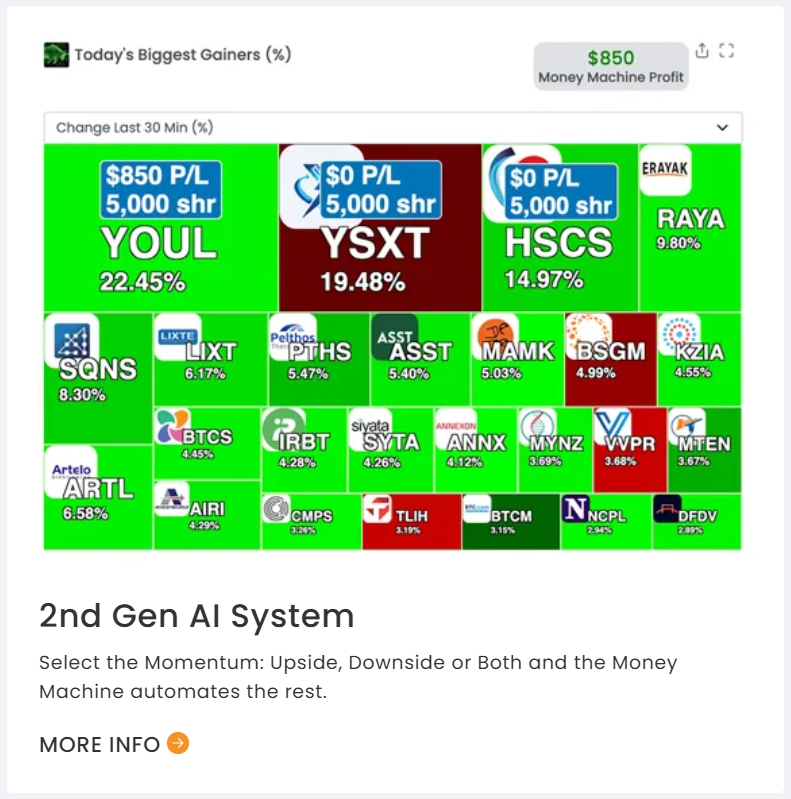
- Money Machine (2nd Gen AI)
Automates trades based on top-ranked momentum stocks, helping users position themselves for the most profitable opportunities. - AI Strategy Lab & Backtesting
Test trading strategies using historical data and AI-generated insights to optimize your trades before committing real capital.
- Paper Trading & Real-Time Data
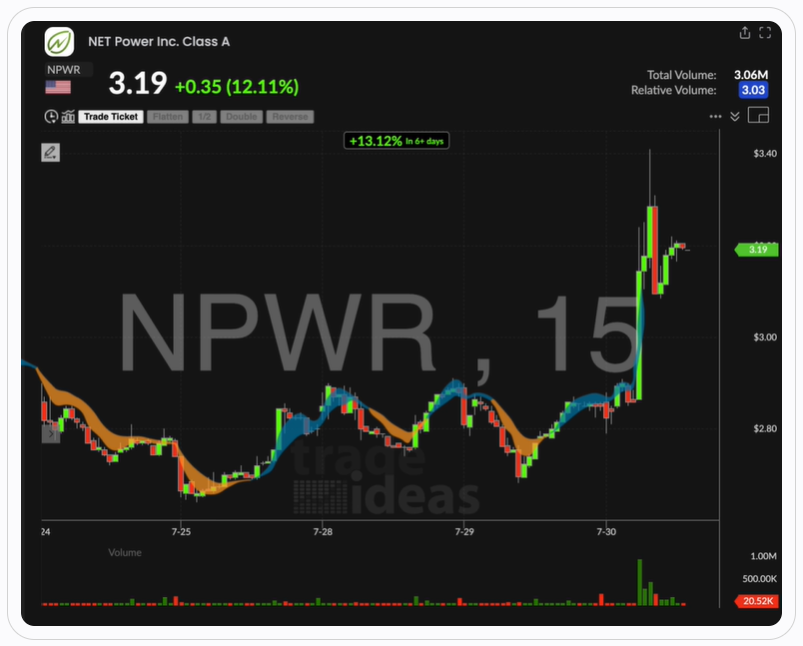
Simulate trades in a risk-free environment or trade live with integration to brokers like Interactive Brokers, CenterPoint, and Cobra Trading. - Interactive Charts & Stock Races
Multi-layout, PiP charting, and stock races provide a gamified and interactive way to monitor market activity and top-performing stocks.
Pricing Plans of Trade Ideas 💰
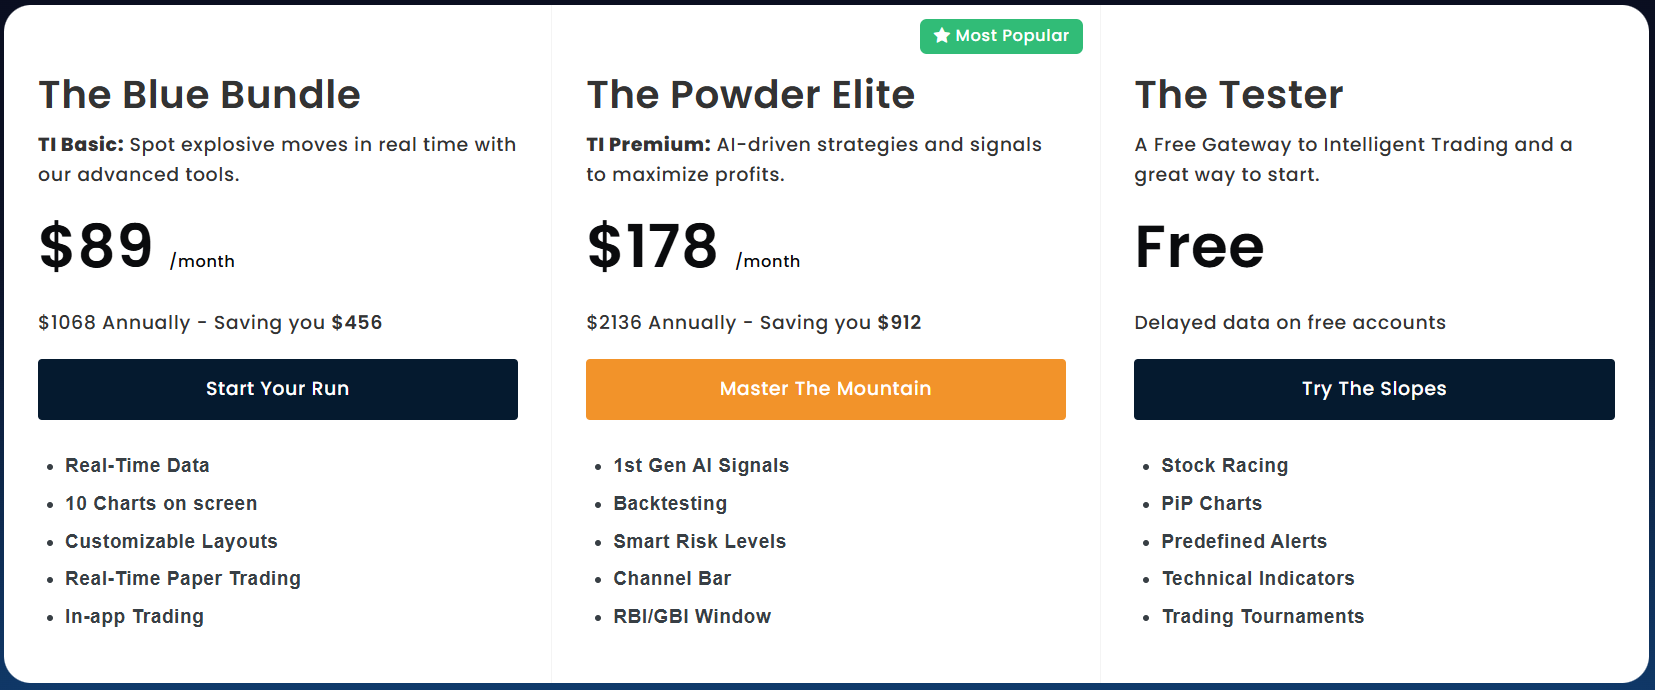
- The Blue Bundle – $89/month ($1,068/year, save $456): Spot explosive market moves in real-time with advanced charts, layouts, and in-app trading. Includes real-time paper trading and up to 10 charts on screen, ideal for active traders.
- The Powder Elite – $178/month ($2,136/year, save $912): Maximize profits with AI-driven strategies, signals, and risk management tools. Features backtesting, advanced AI signals, and The Tester for professional-level trading.
- Free Plan – $0: Get started with a risk-free account and explore key trading features at no cost. Includes stock racing, PiP charts, predefined alerts, and basic technical indicators with delayed data.
Pros & Cons of Trade Ideas ✅
| Pros 👍 | Cons 👎 |
|---|---|
| AI-driven real-time trading signals for actionable insights | Higher cost, especially for new or casual traders |
| Automated trading with Money Machine ranks top momentum stocks | Can be overwhelming for beginners due to advanced AI features |
| Interactive charts, PiP charting, and multi-layout analysis | Requires learning curve to use AI Strategy Lab effectively |
| Backtesting and paper trading for risk-free strategy testing | Some features require integration with external brokers |
| Real-time alerts and notifications for momentum and price movements | |
| Stock races and gamified features make monitoring fun and interactive |
#6. TC2000
TC2000 is a comprehensive stock and options charting platform and screener that has been trusted by traders for over two decades.
It combines dynamic charting, low-latency market data, and powerful scanning tools with customizable layouts, options strategies, and practice trading, allowing both beginners and professional traders to analyze, trade, and manage their portfolios efficiently.
Key Features of TC2000 🌟
- Dynamic Charting
Experience smooth zooming, panning, and powerful drawing tools with customizable indicators for professional-grade chart analysis.

- Stock & Options Screener
Scan thousands of stocks in seconds with EasyScan® using custom or predefined conditions to find actionable opportunities. - Options Strategies & Profit/Loss Zones
Visualize options strategies with shaded profit/loss zones and create multi-leg orders with one click.

- Alerts & Reminders
Set automatic alerts for price, indicators, or conditions to never miss trading opportunities. - Custom Layouts & Personal Journal
Organize watchlists, create custom workspace layouts, and maintain a trading journal to track performance and emotions.
Pricing Plans of TC2000 🤑
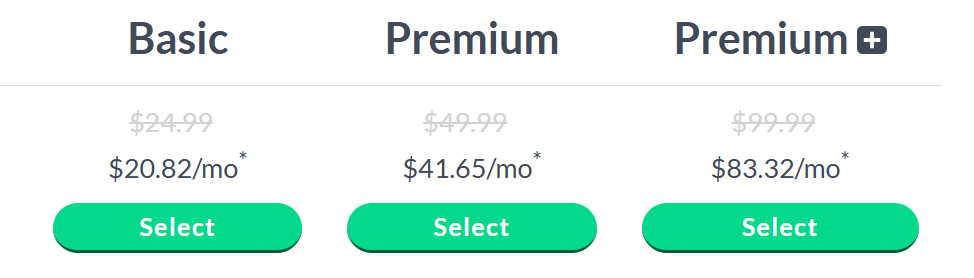
- Basic – $24.99/month ($20.82/mo billed annually)
Access real-time U.S. stocks, live watchlists, customizable layouts, and practice paper trading. Perfect for beginners who want core charting and news tools. - Premium – $49.99/month ($41.65/mo billed annually)
Includes everything in Basic plus real-time scanning, EasyScan® wizard, PCF formulas, multi-monitor support, and alert tracking. Ideal for active traders needing deeper market insights. - Premium Plus – $99.99/month ($83.32/mo billed annually)
All Premium features with real-time market-pulse indicators, auto-refresh filters, intraday performance columns, and up to 1000 alerts. Best for professional traders seeking comprehensive analysis and monitoring.
Pros & Cons of TC2000 ✅
| Pros 👍 | Cons 👎 |
|---|---|
| Dynamic and highly interactive charting tools | Can be overwhelming for beginners |
| Powerful stock and options scanning capabilities | Advanced features require paid subscription |
| Built-in options strategies with profit/loss visualization | Interface can feel dated compared to modern platforms |
| Customizable layouts and watchlists for personalized workflow | Limited brokerage services integration outside TC2000 Brokerage |
| Low-latency data ensures fast market response | |
| Free trading simulator to practice strategies without risk |
Which Is Best TradingView Alternative? 🏆
If you’re hunting for a TradingView alternative, you need a platform that offers powerful charts, market insights, and smart data analysis. While TradingView is popular for its user-friendly interface and community features, one platform stands out as the ultimate choice for serious investors.
After comparing features, pricing, and usability, the winner is Koyfin. 🏆
Why Koyfin Wins:
- Comprehensive Market Data: Access stocks, ETFs, mutual funds, bonds, and macroeconomic indicators all in one place.
- Advanced Charts & Visualizations: From technical charts to economic dashboards, Koyfin makes trends easy to spot.
- Custom Alerts & Watchlists: Track your favorite assets with smart alerts and fully customizable watchlists.
- Portfolio Analysis Tools: Analyze performance, risk, and correlations across all your holdings.
- Affordable and Intuitive: Professional-grade tools without the bloated cost of other platforms.
Conclusion 🔥
Choosing the right trading and market analysis platform can make a huge difference in your investment decisions. While many alternatives like TrendSpider, StockCharts, TC2000, Finviz Elite, and Trade Ideas offer unique features, Koyfin emerges as the clear winner.

It combines comprehensive market data, advanced charting, portfolio insights, and affordability, making it ideal for both serious traders and long-term investors. With Koyfin, you get professional-grade tools without the overwhelming complexity or high costs of other platforms.
If your goal is to analyze, track, and act on the markets efficiently, Koyfin gives you the edge you need to succeed.
Must Read:
- TradingView Review: Is It Best Platform for Traders?
- Motley Fool Review: Is It Best Stock Advisor?
- Kraken Review: Is It Most Secure Crypto Exchange?
FAQs 📢
Yes, many traders combine tools like Koyfin for data and TrendSpider for technical scans to maximize insights.
Most alternatives, including Koyfin, TradingView, and TC2000, have fully functional mobile apps for charting and alerts.
Yes, platforms like Finviz and Trade Ideas offer free or delayed-data versions to explore basic features before upgrading.
Platforms like Koyfin, StockCharts, and TC2000 allow portfolio imports and tracking across multiple accounts.